Human-Agent-Experience
Installation
Schema & Prompt Control
Conversation
Instructions
# Initialize HAX in your projecthax init# Add the componenthax add artifact data-visualizer
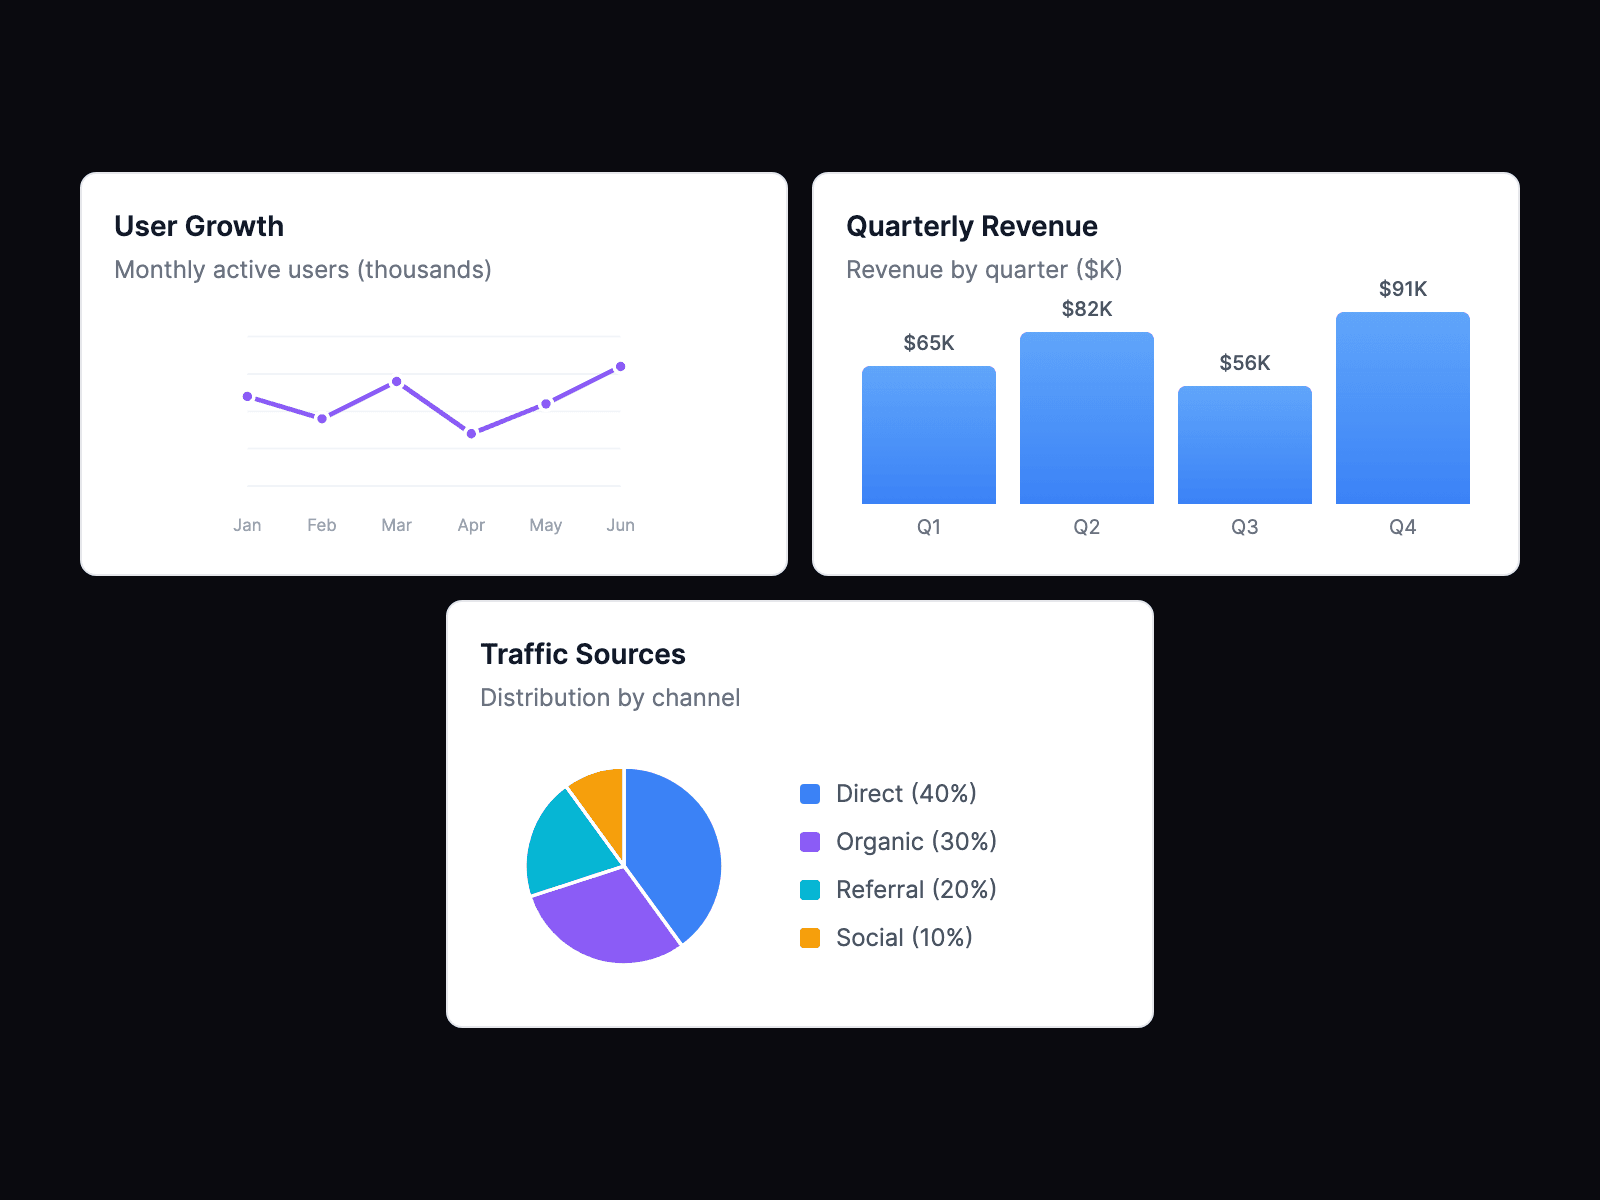
The data visualizer component integrates with AI agents through CopilotKit. Users interact with AI agents through natural language, and the agents automatically create appropriate charts and graphs.
Setup
import { HAXDataVisualizer, useDataVisualizerAction } from "@/hax/artifacts/data-visualizer";export function AnalyticsDashboard() {const [artifacts, setArtifacts] = useState([]);// Register data visualizer actions for AI agentsuseDataVisualizerAction({addOrUpdateArtifact: (type, data) => {// Handle chart updates}});return (<HAXDataVisualizertype="line"data={chartData}options={chartOptions}/>);}
© 2025 Outshift. All Rights Reserved.
Installation
Schema & Prompt Control
Conversation
Instructions
# Initialize HAX in your projecthax init# Add the componenthax add artifact data-visualizer
The data visualizer component integrates with AI agents through CopilotKit. Users interact with AI agents through natural language, and the agents automatically create appropriate charts and graphs.
Setup
import { HAXDataVisualizer, useDataVisualizerAction } from "@/hax/artifacts/data-visualizer";export function AnalyticsDashboard() {const [artifacts, setArtifacts] = useState([]);// Register data visualizer actions for AI agentsuseDataVisualizerAction({addOrUpdateArtifact: (type, data) => {// Handle chart updates}});return (<HAXDataVisualizertype="line"data={chartData}options={chartOptions}/>);}
© 2025 Outshift. All Rights Reserved.